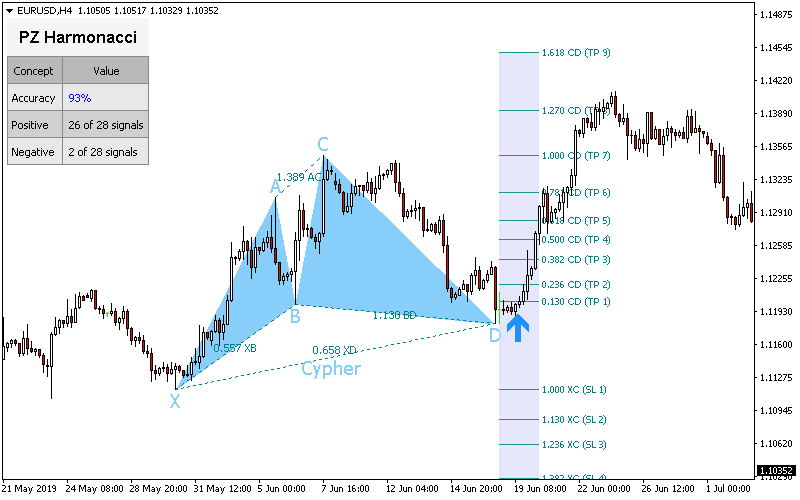
The Harmonacci Patterns Indicator displays suitable stop-loss and take-profit levels for each pattern, and these levels can and should also be used to discard exhausted price patterns upon breakout.
How do we discard unprofitable or risky Harmonacci Patterns? Piece of cake. We want as many untested TP levels as possible when taking the trade. More untested TP levels means the pattern is just starting to unwind, while many reached TP levels means that the pattern is exhausted and is a risky trade.
For example, the following Gartley Pattern is already exhausted when the breakout happens. The breakout bar reached eight out of the nine suitable TP levels in just four hours. This pattern is exhausted and we should not trade it.

In fact, such a fast price movement to the 1.270 CD projection would suggest that going short might be a good idea. Should you be able to confirm a short bias in higher timeframes, shorting instead of buying would seem appropiate.
However, the following Flying Fox Pattern is indeed suitable for trading. Upon breakout, only the second TP level has been reached, leaving seven more suitable exit levels for our trade and minimizing the risk of trading. The following buy signal should be taken.

The goal of trading only patterns with lots of upside are twofold. First, we are decreasing the odds of costly drawdowns and secondly, we are maximizing our profit factor by using free margin wisely.
Conclusion
Filter out Harmonacci Patterns by counting how many profit-targets are pending at the time of trading. A higher number of pending profit targets increases the odds of closing a profitable deal. Discard trades with many profit targets already met.
Feel free to post your comments or questions below. Thank you.
![]()


Where can I download this indicator from?
Thanks for your comment. The indicator is available in my website here:
https://www.pointzero-trading.com/Products/view/PZHarmonacci
Additionally, it is available in the mql5.com market:
For MT4: https://www.mql5.com/en/market/product/1418
For MT5: https://www.mql5.com/en/market/product/1502
Thanks for the post!
Thanks for reading.
Hi Arthur, thank you so much for this post, I found it to be very informative. You’ve done such a wonderful job with this indicator, I enjoy using it. Looking forward to future posts.
Thanks! I will post more trading ideas.
Thank you for adding clarity on how to use your indicator properly!
Thanks!
HI all, where do you set your Sl when you enter the Trade? For example the signals comes by TP2, so how would you trade it with SL and TP?
Hi Max. The indicator offers many SL and TP levels from where to choose from. The TPs can be taken as different incremental profit targets, and the SL is for you to choose from. A valid filter would be ATR for instance, if the SL is not over ATR, then ignore it and use the next one. But you could also take a trade based on a higher timeframe valuation model and decide to use the farthest SL possible to make sure the trade lives long enough to see it through. It is entirely up to you!
What is the ATR?
What do you mean by “decide to use the farthest SL possible to make sure the trade lives long enough to see it through”? when is a trade trough? Reaching the last TP9?
Depends the timeframe. Almost none in D1. A few a week in H4. Many a week in H1. Many a day in M1.