

One of the most difficult problems we traders face is choosing what symbols to trade at any given time, because not all symbols offer the same probability of price movement measured against their intrinsic volatility. As traders, our available funds and free margin are limited, which means that we need to allocate them properly if we are to thrive.
To choose what to trade, successful traders use different methods or as I call them, valuation models. These values can be fundamental, technical, or both. When it comes to forex trading the line between these two blurs.
In this post, I’ll be offering a simple technical valuation model based on the RSI indicator and using multiple correlated forex pairs as the baseline for our decisions. To do so, I’ll be using the Multi Oscillator Indicator.
This technical indicator allows us to draw the RSI -or a host of other indicators- of many symbols in a single oscillator, making it easier for us to spot the odd one out from a set of correlated symbols, and focus our trading activity on those that are more likely to reverse strongly back to the mean. But more importantly, it allows us to stay clear of other trades which would consume free margin and swap costs in a sub-efficient way.
For the purposes of this post, we’ll focus our analysis and trading on the EUR pairs. Let’s begin. Load the indicator to the EURUSD H4 chart and type in the input parameters all the available EUR pairs in your platform.

The indicator will load as displayed below. Each line represents the RSI of a different EUR pair. As you can already see, sometimes a forex pair deviates from the mean and from the other correlated pairs strongly, to later return to the mean.

This is the simple essence of our reversal valuation model. All we have to do is focus our trading activity in the symbols which RSI is extremely out of whack from the other correlated pairs and/or from the mean, as long as a higher timeframe does not invalidate the assessment. If a higher timeframe offers a conflicting valuation, we should not trade. Higher timeframes should at least be neutral for the purpose of our trade.
To make things easier, the Multi Oscillator can be configured to display data from a higher timeframe. This would allow us to blend timing from price action with a higher timeframe instance of our valuation model. Let’s go over some examples.
We can for example buy a fractal breakout in H1 confirmed by the technical valuation model in D1. The oscillator is configured to display Daily levels in the oscillator.


The next example involves shorting EURCAD H4 on a Reversal Fractal.

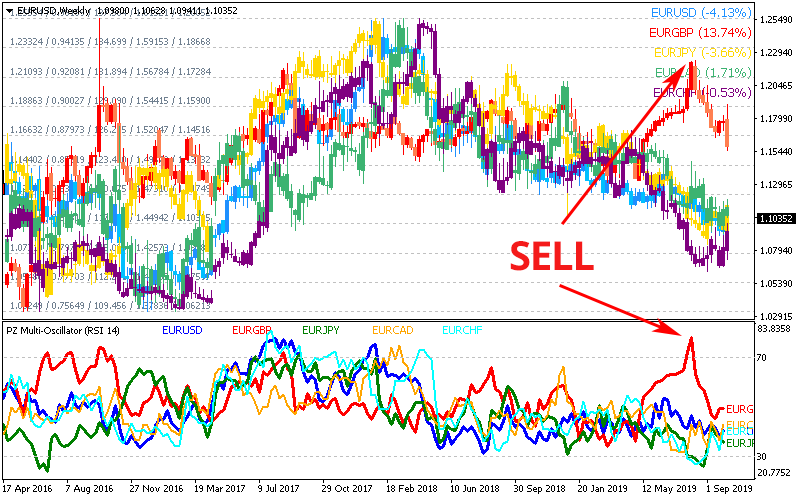
Additionally, this behavior happens in all timeframes. Take a look at EURGBP W1 for example below: the EURGBP exchange rate goes ballistic and out of whack until it tests and rejects a multi-year resistance line, a clear shorting signal. Reserving our free margin to trade big opportunities is, in many ways, much better than trading short timeframes repeatedly for smaller gains.
The biggest advantage of having a proper valuation model in place is that timing becomes less relevant and becomes counter-productive: complex and filtered entry strategies will decrease trading frequency without adding profitability. Moving averages, support and resistance lines, parabolic sar and other simple indicators will provide more than enough timing to trade.
However, I’ve found that Classic Divergences offer the best entry strategy for this particular model, signaling the revertion to the mean with accuracy and avoiding early entries that can waste free margin and swap costs. On the flipside, the trading frequency will decrease slightly.
Conclusion
The multi-oscillator indicator allows us to plot the RSI of many correlated currency pairs in a single chart and spot the odd one out easily. Currency pairs with RSI values well over or well below all others are likely to make a reversal back to the mean.
Feel free to post your comments or questions below. Thank you.
![]()